In today’s fast-paced business environment, having quick and easy access to crucial data is essential. Whether you’re a small startup or a large enterprise, the ability to visualize key metrics at a glance can make a significant difference in decision-making. Enter the Odoo Dashboard module—a powerful data and visualization tool that offers a unified view of your business data, tailored to your specific needs.
What is the Odoo Dashboard Module?
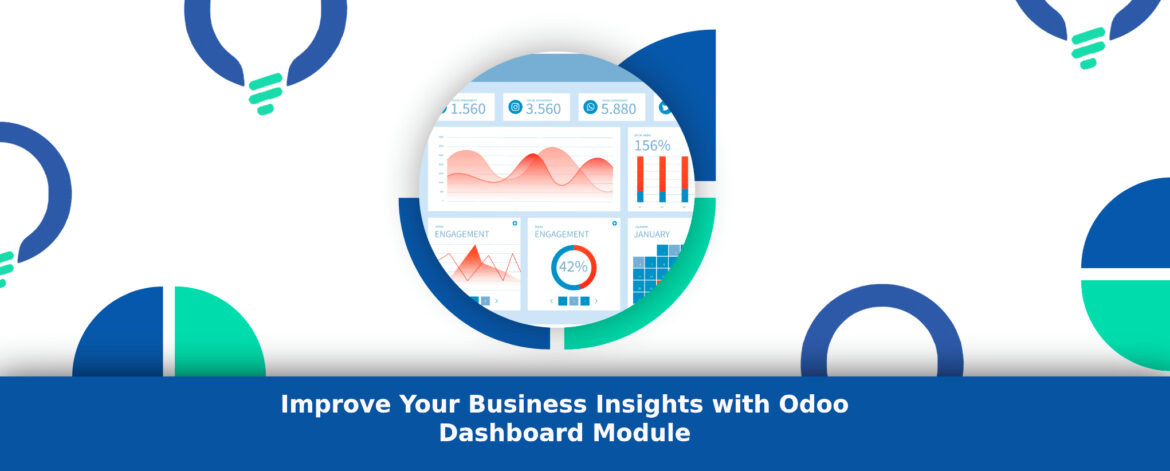
The Odoo Dashboard module is a data and visualization tool within the Odoo ERP system that allows users to create personalized dashboards. These BI Intelligence dashboards can display a wide range of data from different modules, such as Sales, Accounting, Inventory, and more. The goal is to provide a consolidated view of vital business metrics, enabling users to monitor performance, identify trends, and make informed decisions.
Key Features and Benefits
Customizability
One of the standout features of the Dashboard module is its flexibility. Users can easily create and modify dashboards to suit their specific requirements. Whether you need to track sales performance, monitor inventory levels, or analyze financial data, the Odoo Dashboard can be tailored to display the most relevant information.
Real-Time Data
The Dashboard module provides real-time data updates, ensuring that you always have the most current information at your fingertips. This is particularly valuable for businesses that need to respond quickly to changes in the market or internal operations.
Interactive Visualizations
The module offers a variety of visualizations, including bar charts, pie charts, line graphs, and more. These interactive elements make it easy to understand complex data and identify trends and patterns.
User-Friendly Interface
The dashboard’s intuitive interface makes it accessible to users of all technical levels. Whether you’re a seasoned data and visualization analyst or a business owner with limited technical expertise, you can easily navigate and customize your dashboard.
Integration with Other Modules
The Dashboard module seamlessly integrates with other Odoo modules, allowing you to pull data from various sources into a single, cohesive view. This integration facilitates a holistic understanding of your business operations, from sales and marketing to finance and logistics.
Practical Applications
The Odoo BI Intelligence Dashboard module can be used across various business functions. Here are a few examples:
Sales & Marketing: Track sales performance, monitor lead conversion rates, and analyze marketing campaign effectiveness.
Finance: Keep an eye on financial metrics like revenue, expenses, and profitability. You can also track cash flow, outstanding invoices, and other key financial indicators.
Inventory Management: Monitor stock levels, track product movement, and optimize inventory management processes.
Human Resources: Analyze workforce metrics, such as employee performance, attendance, and turnover rates.
Getting Started with Dashboard
Implementing Odoo’s BI Intelligence Dashboard module is straightforward. Start by identifying the key metrics you want to track. Then, use the module’s selection-based interface for each metric that you require. Customize the layout to suit your preferences, and start visualizing your data in real time with BI Intelligence.

Conclusion
The Odoo Dashboard module is an indispensable data and visualization tool for businesses looking to gain a comprehensive understanding of their operations. Its customizability, real-time data capabilities, and user-friendly interface make it a valuable asset for any organization. Whether you’re looking to streamline decision-making, identify growth opportunities, or simply keep a finger on the pulse of your business, Odoo has you covered. Simply Connect with us and Let our expert Odoo developers and Consultants take care of it.


